

VIX Term Structure — April 17, 2026
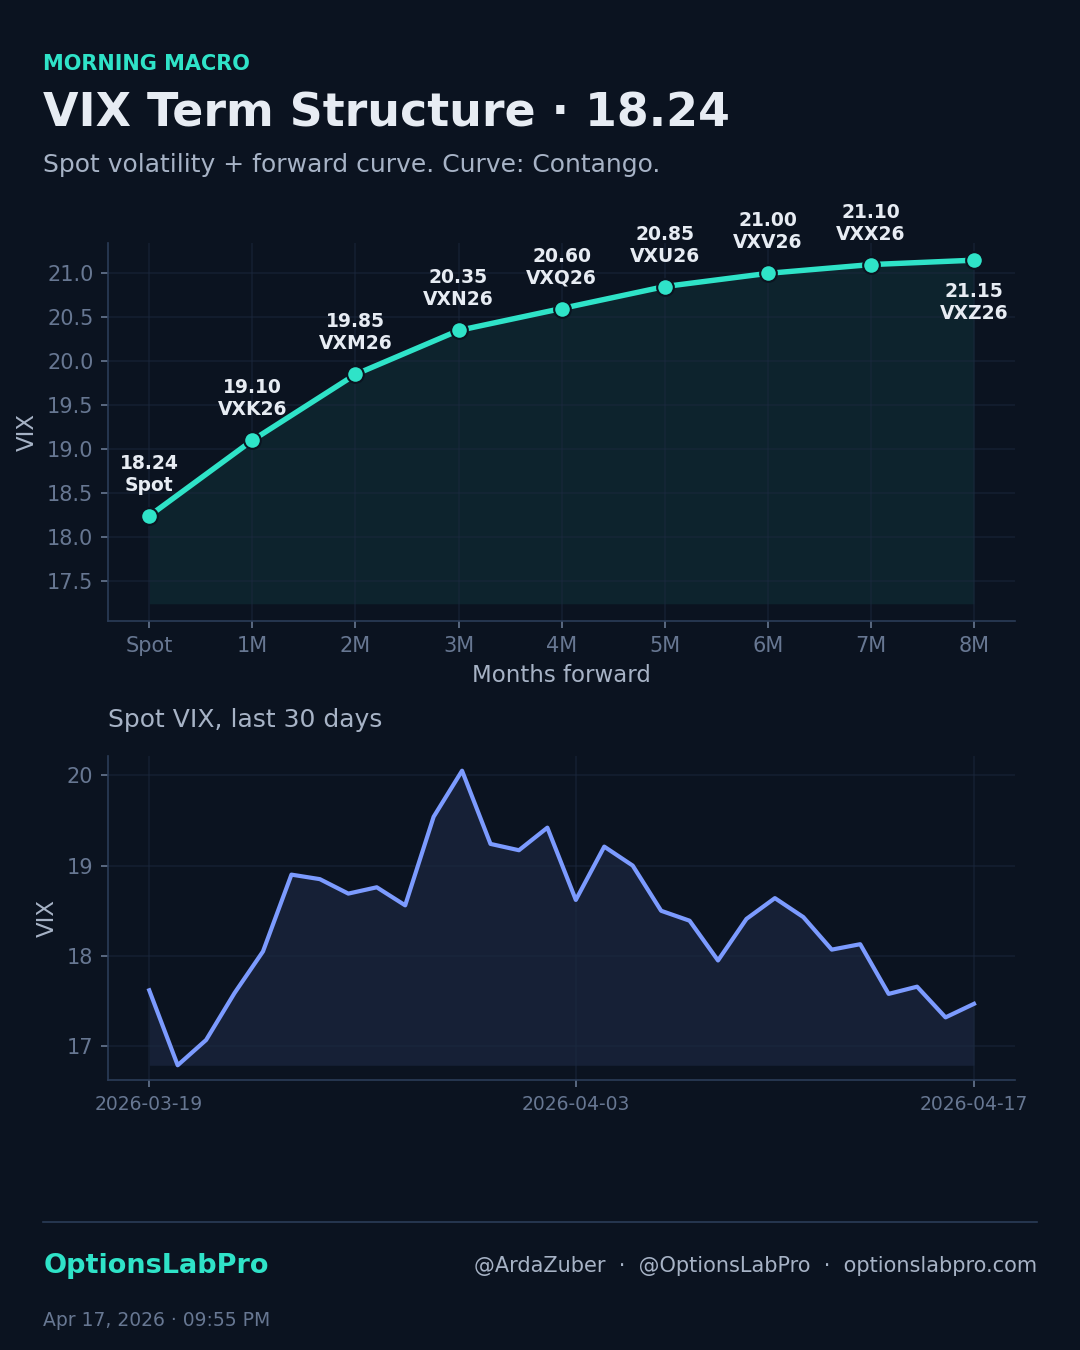
The VIX term structure is one chart that tells you where the market thinks risk lives — not today, but two weeks, two months, six months out.
The Snapshot (April 17, 2026)
- Spot VIX: 18.24
- Front-month future (VXK26): 19.10
- Back-month future (VXZ26): 21.15
- Regime: Contango
Why The Curve Shape Matters
The curve is in contango: futures are priced higher than spot VIX. Translation: the market thinks today is calm but later-dated risk deserves a premium. For the theta-seller, this is your friend — roll long-dated shorts forward and let the curve pull them in.
Reading It The Way A Pro Does
Look at three things when the VIX curve prints:
- Slope — steep upward slope (deep contango) is complacency; flat or inverted is stress.
- Level — a curve sitting around 15 with mild contango is business-as-usual; the same shape anchored at 25 is something very different.
- History — one day's print is noise. The 30-day VIX history in the footer of the chart is where regime shifts show up.
How to Use This on OptionsLabPro
Term-structure trades (calendars, diagonals) are exactly where the Strategy Sandbox earns its keep. Drop in a calendar spread, drag the IV slider for front vs back month separately, and watch P&L react. That's the muscle memory you need when the curve actually shifts on you.
For a simpler feel, the Greeks Explorer lets you drag the DTE slider and see Vega reshape across expirations — which is the same phenomenon the VIX curve is showing, just from the single-option side.