

Sector Scoreboard — April 17, 2026
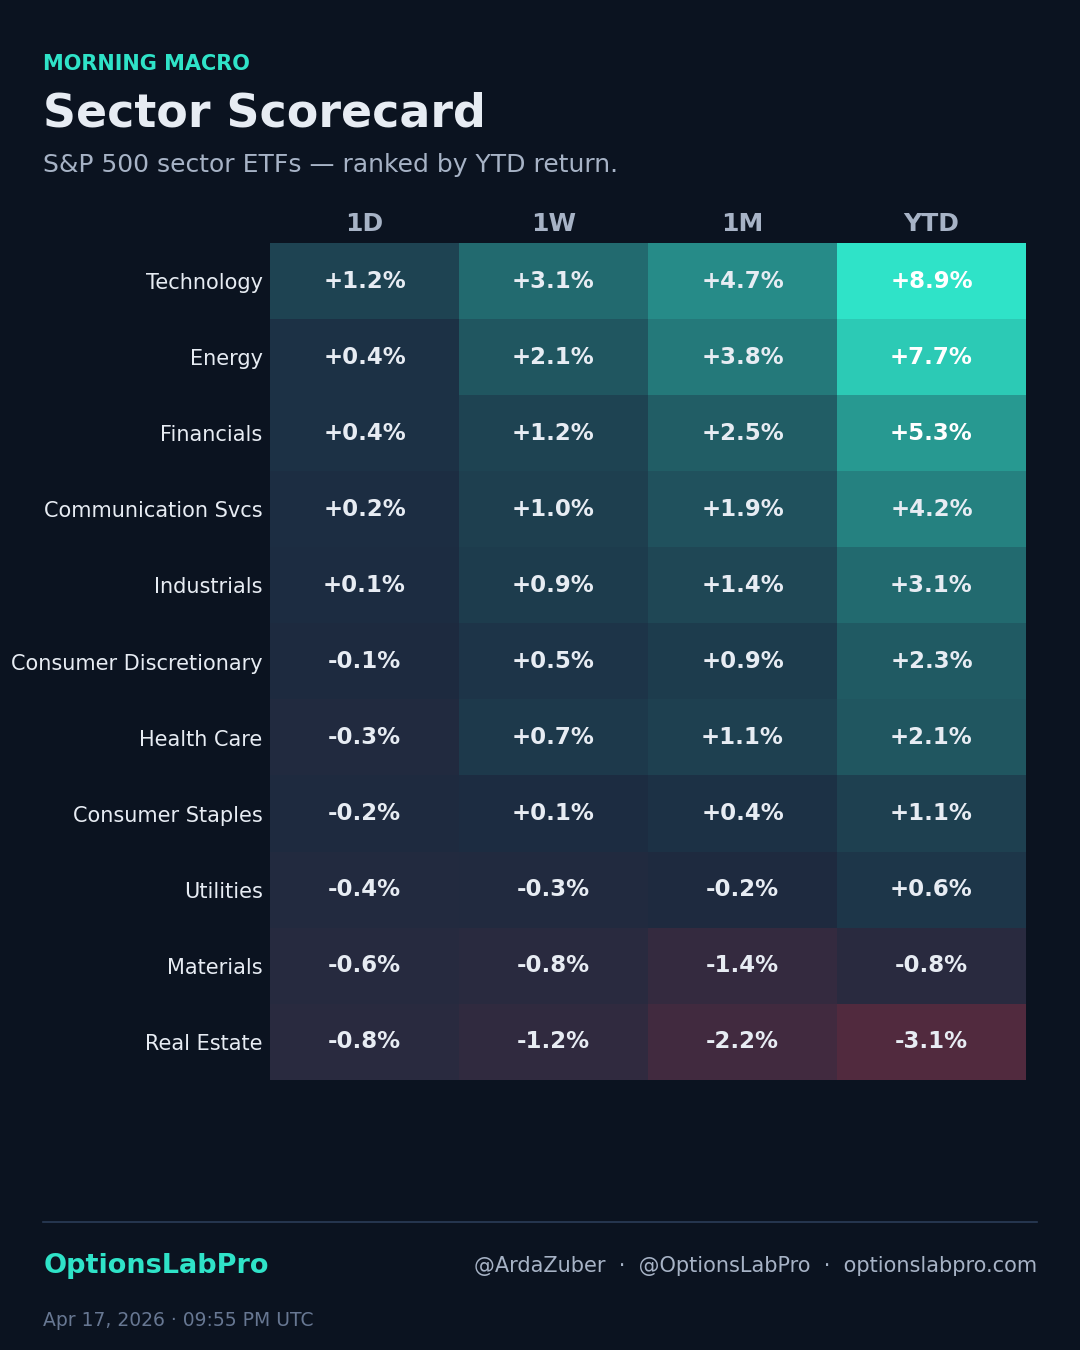
Sector returns are the market's honest-to-goodness scoreboard. Everything else is narrative; this is money in motion.
YTD Leaders (April 17, 2026)
- Technology (XLK) — +8.90%
- Energy (XLE) — +7.70%
- Financials (XLF) — +5.30%
YTD Laggards
- Real Estate (XLRE) — -3.10%
- Materials (XLB) — -0.80%
- Utilities (XLU) — +0.60%
What This Chart Tells You
Technology is doing most of the work in the index right now. Real Estate is a drag. If you're running a neutral options book, that divergence tells you where the IV is — strong leaders tend to see implied vol compress (money keeps buying the stock, not protection), while laggards see IV build as hedging demand spikes.
For a single-leg strategy, laggards-with-bounce-potential are where calendar spreads and covered puts earn their keep. Leaders are where credit spreads on the call side stop paying enough to justify the risk.
How to Use This on OptionsLabPro
Want to see what the implied vol of each sector ETF is telling you? Load any of these tickers into the Options Chain Simulator and drag the IV slider. Watch the premiums reprice at both ends of the curve.
Or, if you want to build a defined-risk bet on rotation continuing or reversing, the Strategy Sandbox has one-click bull-call and bear-put spreads with the payoff curve drawn live.