

 Arda Zuber, PhD
Every options pricing model you have ever used carries an assumption its authors were open about and its users mostly forgot: that returns are normally distributed.
Under that assumption, a five-standard-deviation crash is not merely unlikely. It is close to impossible — the kind of number where you run out of adjectives before you run out of zeros.
Real markets produce one about once a decade.
The gap you are short
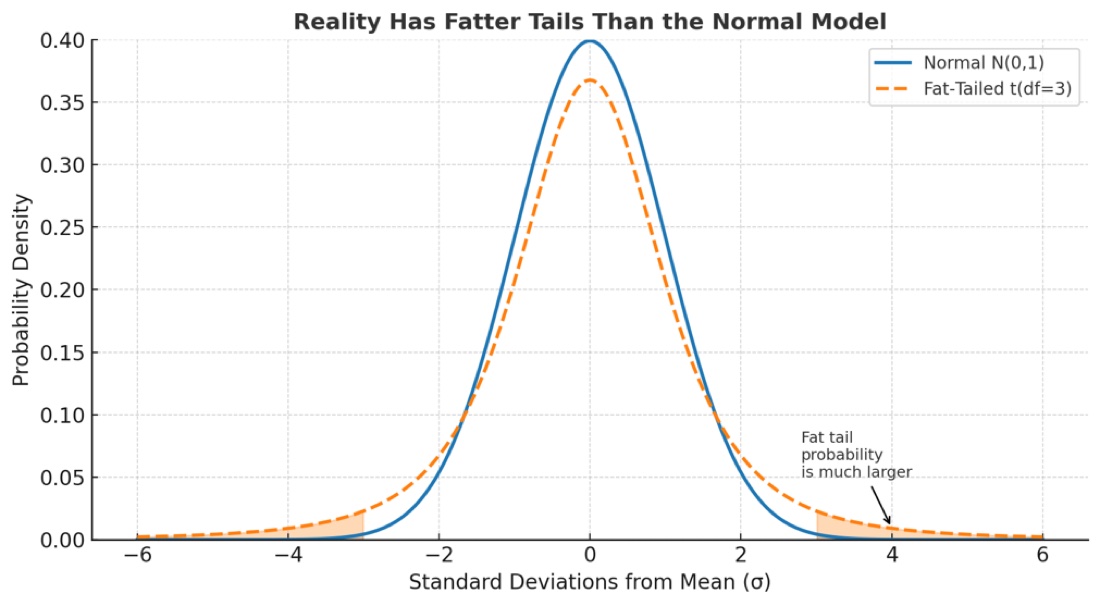
Two curves, and the difference between them is the whole subject.
The solid line is the textbook normal distribution. Beyond ±3σ it is essentially flat against the axis — those outcomes barely exist.
The dashed line is a fat-tailed distribution, a closer proxy for how markets actually behave. Look at the shaded regions in the tails: not slightly larger, substantially larger.
Selling options means being short the tails. So the difference between those two curves is not an academic quibble about model choice. It is the part of your risk that the pricing did not charge for, and you are holding it.
Why markets are not normal
The normal distribution assumes each move is independent of the last. Markets are not built that way.
Panic induces panic. Selling forces more selling — margin calls, stop-losses, redemptions, risk limits — and each mechanism converts a move into a bigger move. The feedback that makes a market a market is exactly what fattens the tail.
A bell curve describes coin flips. It does not describe a crowd.
Where this comes from
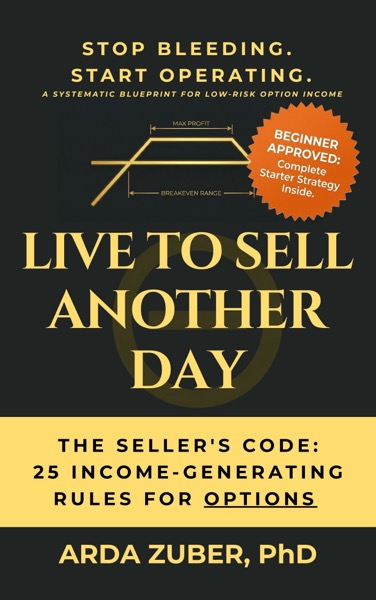
Wisdom 15 of Live to Sell Another Day: The Seller's Code — twenty-five rules distilled from real losses, organised around risk rather than a catalogue of strategies.
Live to Sell Another Day on Amazon →
What it feels like from inside
This is the shape that makes tail risk so hard to respect: you win small, consistently, for a long time, and then lose large, once.
Every quiet month is evidence the approach works. The evidence accumulates, confidence grows with it, and size usually grows too. Then a single week undoes several years, and the post-mortem finds nothing that was obviously wrong — because nothing was, except the assumption that the quiet years were the whole sample.
The book's phrase for it is picking up pennies in front of a steamroller. The pennies are real. That is precisely the problem.
The rule that follows
Price the outlier, not the average.
Not "expect a crash next month" — nobody can time it. The operational version is a test you can apply to a position before you open it:
If this trade cannot survive a 3-sigma shock, size it down or define the risk.
Two ways to pass it:
- Reduce size until the shock is painful rather than terminal
- Define the risk with a spread, so the maximum loss is a number you chose rather than one the market chooses
Both cost you some premium. That premium is the price of still being here afterwards.
The honest framing
None of this says premium selling is a bad business. It says the profits and the losses arrive on different clocks, and any assessment shorter than the interval between shocks is measuring only half of it.
A strategy that has produced three excellent years and never met a real dislocation has not been tested. It has been observed during a calm stretch, which is a different thing, and the distinction only becomes visible afterwards.
Keep reading
- Sizing for the loss rather than the win
- Why 100% IV is a trap
- Why ticker count is not diversification
OptionsLabPro is a structured options course built on interactive lessons.