

 Arda Zuber, PhD
Most people size a trade by asking how much they want to make. The number that determines whether you are still trading next year comes from the opposite question.
Five in a row is normal
Start with the fact that makes sizing matter: a five-trade losing streak is an ordinary event.
At a 70% win rate — perfectly achievable selling premium — five consecutive losses will show up regularly across a few hundred trades. It is a feature of the distribution, not a sign that something broke. Any plan that only survives when losses arrive politely spaced is not a plan.
So the real question is not whether the streak comes. It is what it costs when it does.
What it costs, exactly
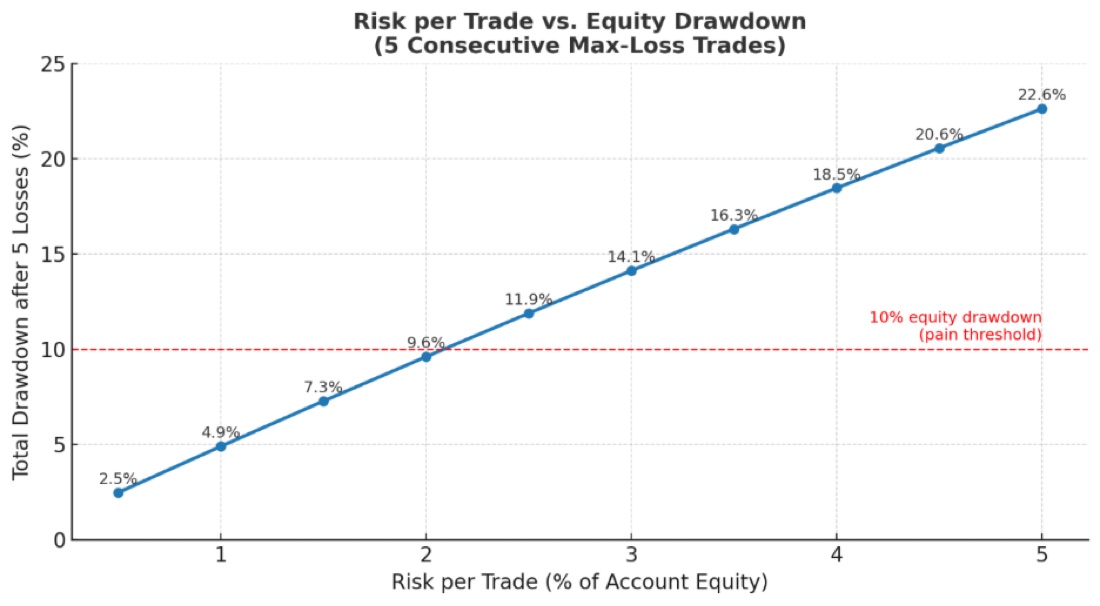
The same streak, at different risk levels:
| Risk per trade | Drawdown after 5 losses |
|---|---|
| 0.5% | 2.5% |
| 1% | 4.9% |
| 2% | 9.6% |
| 3% | 14.1% |
| 4% | 18.5% |
| 5% | 22.6% |
The red line is the pain threshold — roughly where drawdowns stop being an accounting event and start changing behaviour. Past it, people abandon rules, size up to recover, or stop trading at the worst moment.
Notice where 2% lands: 9.6%, right against the line. That is not a coincidence, it is why 1-2% is the common answer. It is the range where a normal bad run stays a normal bad run.
Where this comes from
Wisdom 12 of Live to Sell Another Day: The Seller's Code — twenty-five rules distilled from real losses, organised around risk rather than around a catalogue of strategies.
Live to Sell Another Day on Amazon →
The rule underneath
Size every trade to survive being wrong.
The profit side is not yours to set — the market decides it. The loss side is entirely yours, chosen before you enter, and it is the only part of the trade you fully control.
Which produces the practical test:
If you cannot state your maximum loss in dollars before you click send, the position is not sized. It is guessed.
For a defined-risk spread the number is the width minus the credit. For a naked short put it is the strike minus the premium, times 100 — a large number that people avoid computing precisely because it is large.
Where sizing quietly fails
Two ways, both common:
Correlation. You hold 1% in three different names and believe you are at 1%. If all three are the same sector or the same macro driver, you are at 3% on one bet. Ticker count is not diversification; measure exposure by driver, not by symbol.
Volatility regime. A position sized correctly in a calm market is oversized when volatility doubles. The dollar amount did not change; the distribution of outcomes did. When the regime shifts, cut size — the same trade is not the same risk.
The arithmetic nobody enjoys
Drawdowns are asymmetric, and the asymmetry accelerates.
Lose 10% and you need 11% to get back. Lose 20% and you need 25%. Lose 50% and you need 100%.
That curve is the entire argument for staying small. The gains you give up by sizing conservatively are linear. The damage you avoid is not.
Keep reading
- Fat tails and the moves models call impossible
- Why ticker count is not diversification
- Matching size to the volatility regime
OptionsLabPro is a structured options course built on interactive lessons.